
Software
AquaNET
Smart and innovative management for your water network.
AquaNET offers a range of web-based, desktop and mobile tools, along with analysis and modelling procedures dedicated to managing and improving the water efficiency and sustainability of water networks. It uses a flexible, customisable structure based on the latest scientific research, to ensure consistently cutting-edge solutions. Unlike standard GIS viewers, it integrates a mathematical hydraulic model, real-time monitoring tools, AI-based alerts and a mobile app for field operators.
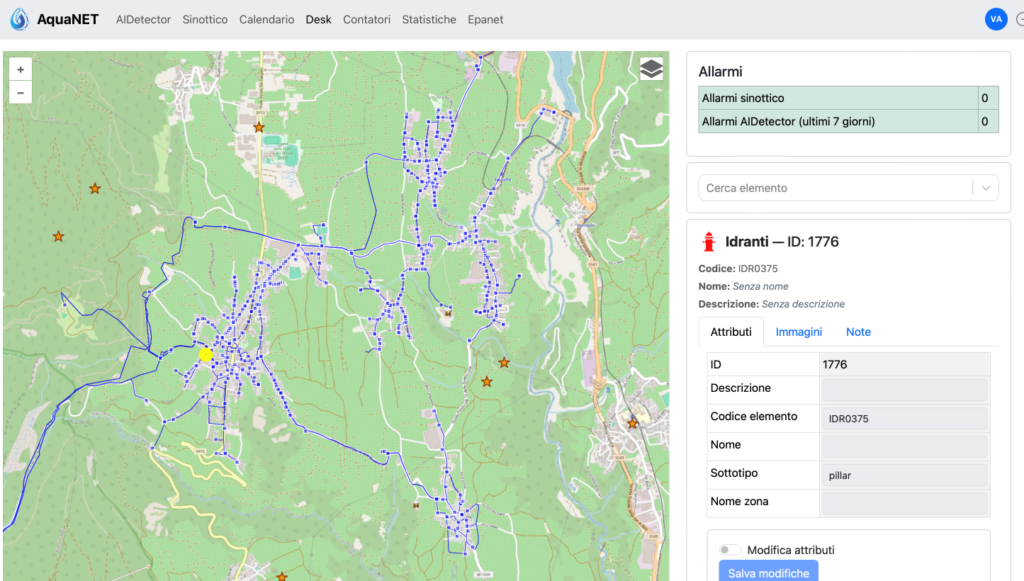
Georeferenced mapping
AquaNET includes a dedicated module for managing spatial data, allowing the integration of different sub-services for both viewing and editing.
The platform brings together all the network’s topological elements in a single interactive environment, allowing the utility to speed up daily operations.
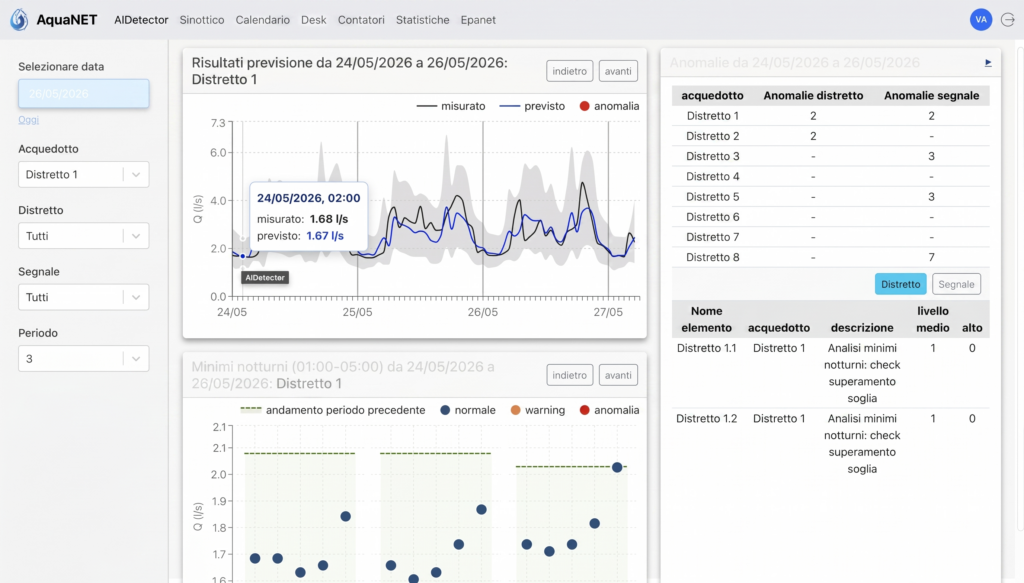
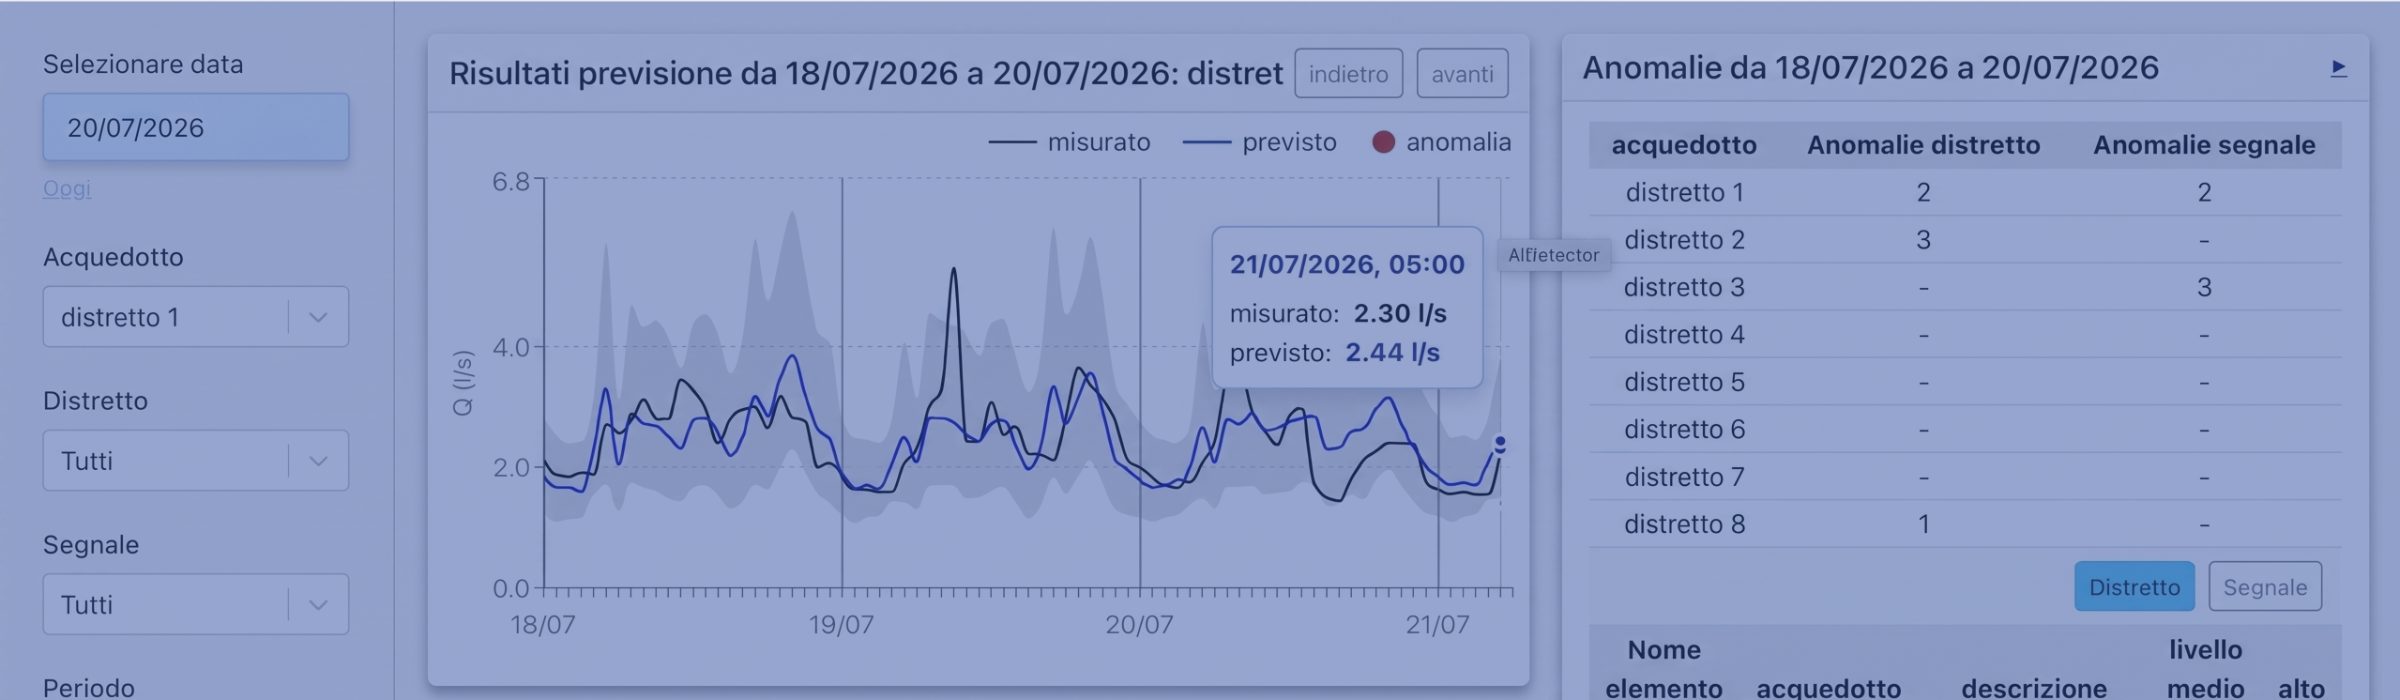
AI-Detector district monitoring
This module uses Artificial Intelligence algorithms to analyse water flows entering and leaving districts, constantly comparing real measured data with the predictive model. The dashboard shows real-time flow trends and changes in night-time minimum flows.
The software autonomously identifies deviations between real and predicted data and generates instant alerts in the event of bursts or consumption anomalies.
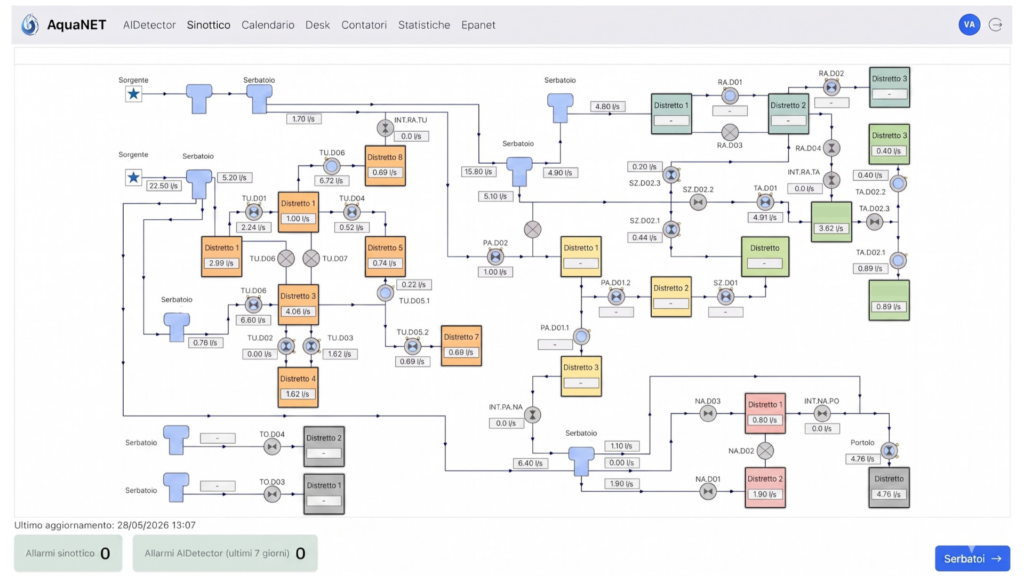
Interactive synoptic diagram
The synoptic diagram allows operators to monitor the current status of all elements of the water network at any time: springs, storage tanks, flow dividers and detailed information on districts.
The interface updates in real time, showing transit flows (in l/s), tank fill levels, and inflow and outflow through valves. It is also possible to view the length of each district (km), base demand (l/s), diameters and minimum and maximum elevations.
Tank monitoring
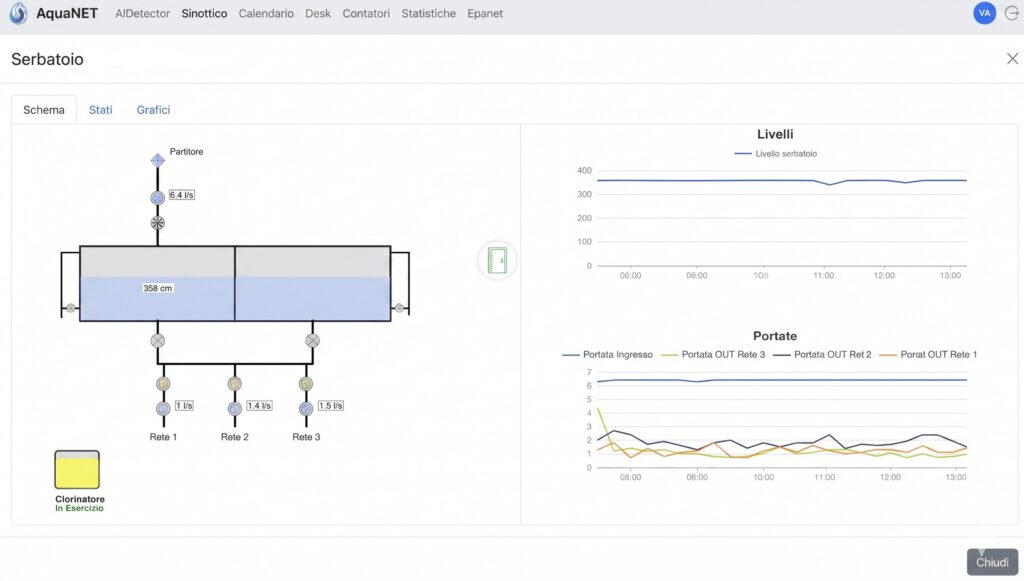
AquaNET manages data from tanks and valves to provide in-depth, real-time analysis. Within the software, individual infrastructure elements such as tanks can be consulted, each with a visual, interactive detail sheet. The dynamic functional diagram shows instantaneous tank fill levels, inflows and outflows broken down by network, as well as the operating status of auxiliary components (such as chlorinators).
For each element, charts are available showing levels, flows and pressures throughout the day.
Statistical analysis and comparisons
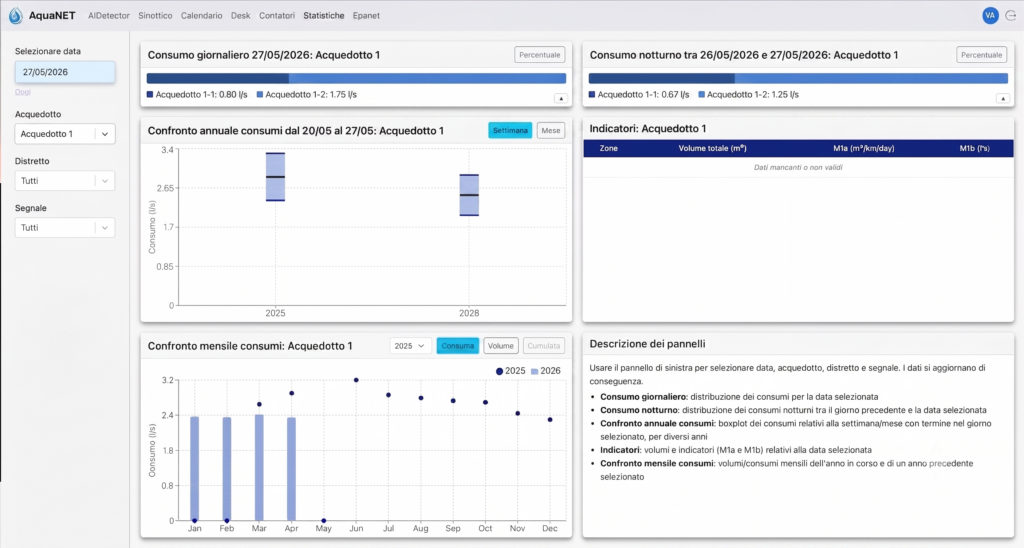
By selecting a specific water network or district, the system automatically generates charts and reports to monitor actual volumes involved and water balances.
The interface allows you to analyse consumption distribution across the utility’s various districts, and generates a comparison between consumption for the current year and the previous year.
Finally, a dedicated table calculates total volumes and ARERA indicators (M1a and M1b), ensuring constant control over network efficiency.
Meter management and smart readings
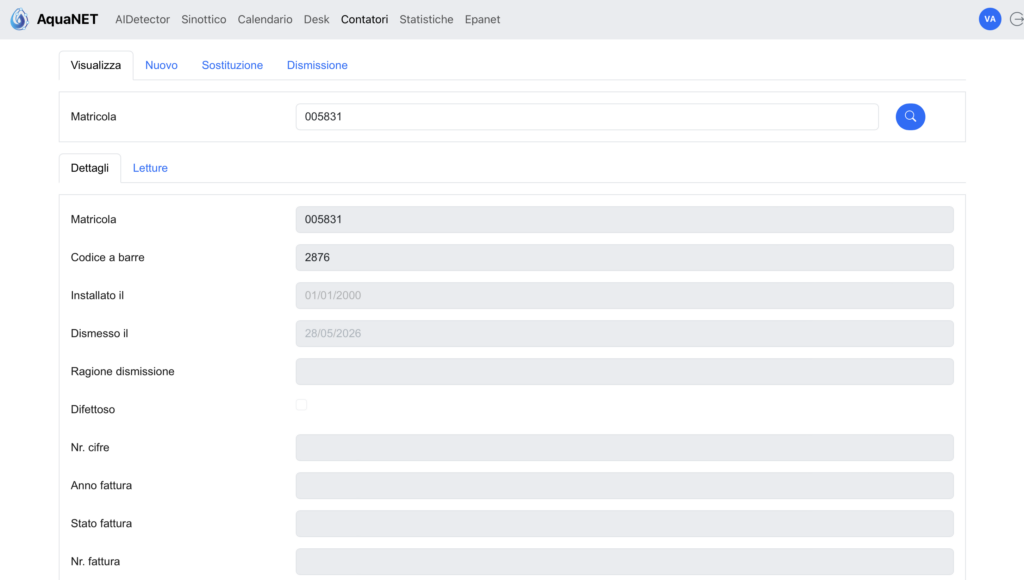
An administrative and operational module dedicated to complete control of the water network’s meters. The interface allows individual users to be searched for.
The system is integrated with the mobile app (AIAPP), allowing operators to record readings, report faults and manage replacements directly in the field, with immediate synchronisation to the central database.
Integrated hydraulic model
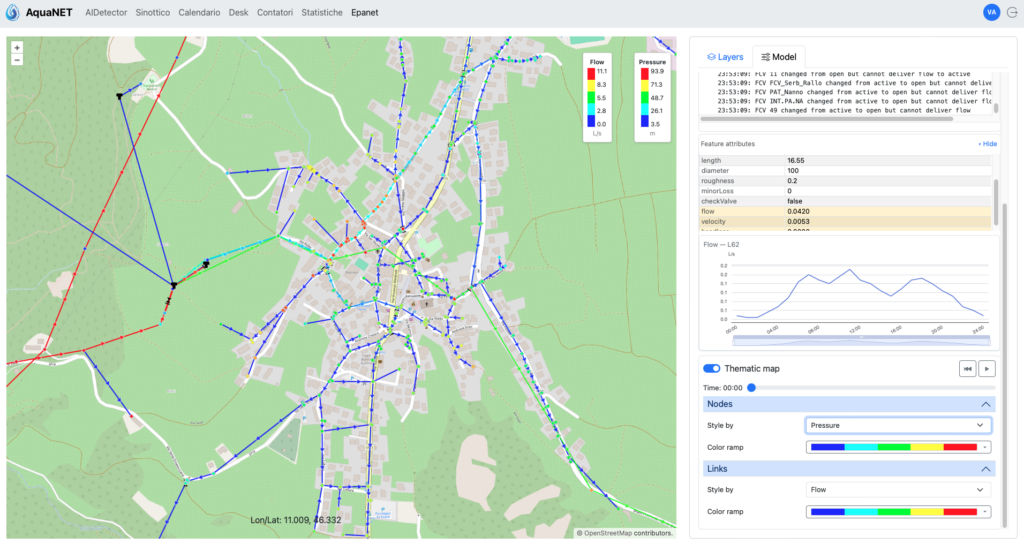
Unlike standard static viewers, AquaNET features a mathematical hydraulic model integrated directly into the web platform.
The interface applies a colour-coding system to display node pressures and transit flows along all pipes. By selecting a single network element, the side panel returns complete technical details (such as diameter, length and roughness) and generates an interactive chart showing the pressures and flows the system expects over a 24-hour period.
Ready to modernise the way you manage your water?
Request a demo and discover how our software can help you manage water more rationally, sustainably and with a long-term vision.